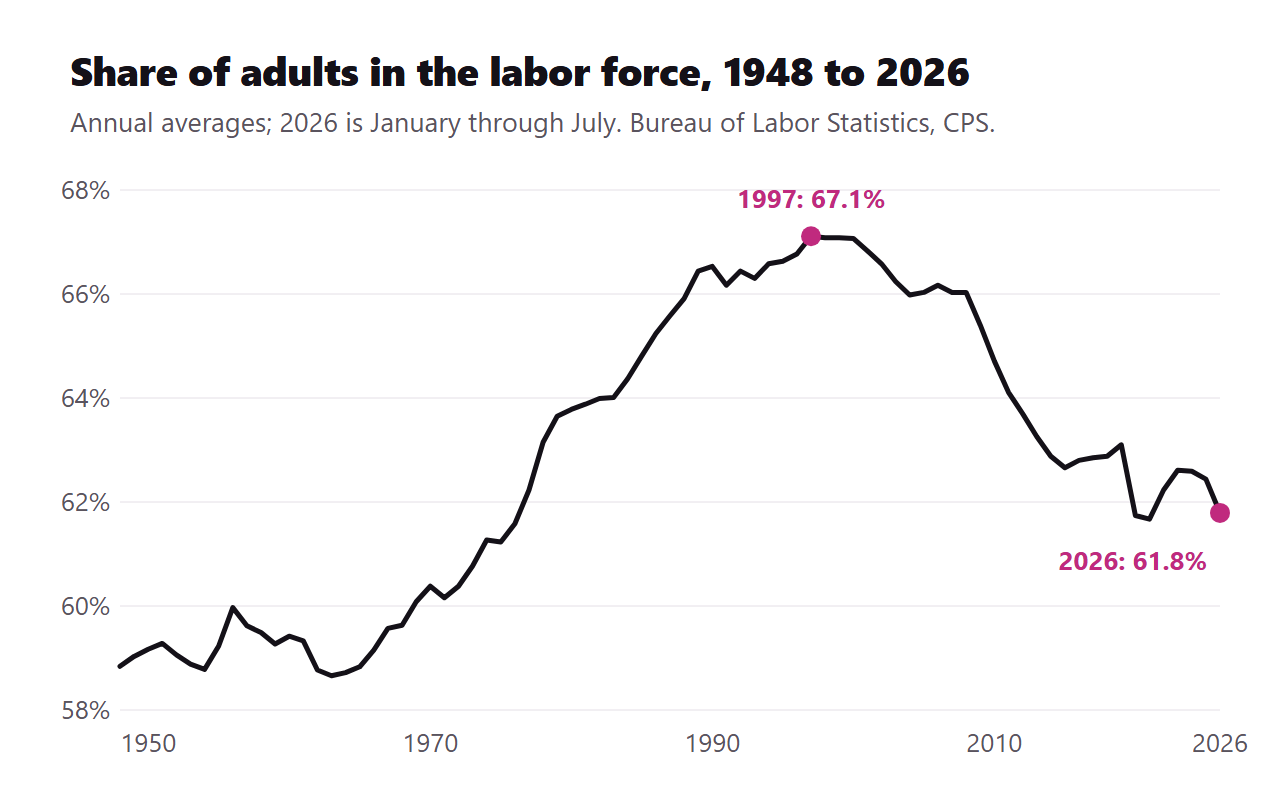
On the first Friday of most months the government publishes the unemployment rate, and the country argues about it. In July it was 4.1 percent: 6.9 million people out of work and actively looking. In the same table sits a number that never gets a headline. 106,189,000 Americans, age 16 and over, were neither working nor looking. That is more than one in three adults, and it is the highest count ever recorded.
The bureau's phrase for these people is "not in the labor force". You are in this category if you did no paid work in the survey week and did not look for any in the four weeks before it. Nothing about the label implies idleness or failure: it holds every retiree, every full-time student over 15, most family caregivers, millions of people too ill to work, and everyone who looked for so long that they stopped. In the survey's own codebook the phrase is shortened to an acronym.
That acronym is on our sign, which we will get to at the end. First the number itself, because almost everything said about it in public is either stale or wrong, and the checked version is more interesting.
Jump to: The count · Who they are · Why hiring froze · What they live on · What the support pays · The name on the door · Sources
The count
Every American adult is in exactly one of three boxes, and the third box is by far the biggest.
| Adults 16 and over, July 2026 | People | Meaning |
|---|---|---|
| Working | 162.2 million | employed, any hours |
| Looking | 6.9 million | unemployed: searched in the last 4 weeks |
| Neither | 106.2 million | not in the labor force |
The box has been filling for a generation. At the participation peak in early 2000, 69 million people were outside the labor force and the participation rate was 67.3 percent. Since then the count has grown by 37 million. Most of that is demographics rather than drama: the boomers aged into retirement, and a 70 year old who stops working is not an economic mystery.
This year it is also drama. The count rose by 2.9 million people in the first seven months of 2026 alone, and participation fell to 61.4 percent in July. That level was last touched in the pandemic winter of 2021, and before that you have to go back to March 1976, when most married women had not yet entered paid work, to find a month as low.
One more figure keeps the rest of this piece honest: of the 106.2 million, only 5.9 million tell the survey they want a job right now. About 1.9 million of those searched within the past year, and 503,000 are counted as discouraged, meaning they stopped searching because they believe nothing is out there for them. The overwhelming majority of people outside the labor force are not queuing at a door that will not open. But for the minority who are, the door got heavier, which is the part the averages hide.
Who they are
The government's most recent full breakdown of why people are out dates from 2022, when the annual count stood at 94.5 million. The shares are the point.
| Reason given | People | Share |
|---|---|---|
| Retired | 48.8 million | 52% |
| In school | 15.0 million | 16% |
| Ill or disabled | 14.5 million | 15% |
| Caring for home or family | 13.1 million | 14% |
| Other reasons | 3.0 million | 3% |
BLS Monthly Labor Review, September 2024, from the CPS annual supplement. Measured on an annual yardstick (people who neither worked nor looked at any point in 2022), which is a wider net than the monthly count above. It is the latest reasons breakdown the bureau has published.
Retirement is half the box, and retirement explains nearly three quarters of the growth since 1999. Whoever tells you the 106 million are proof of a broken country is skipping the 48.8 million of them who worked for forty years and stopped, as planned, with a pension claim to show for it.
The harder stories are inside the other half. Prime-age men, 25 to 54, participate at 89.2 percent today against a shade under 98 percent in the mid-1950s: one man in nine is out now, against roughly one in fifty then. The most common reason they give is illness or disability, and it is growing. The late Alan Krueger found that nearly half of prime-age men outside the labor force take pain medication daily, and his corrected estimate tied about 43 percent of the 1999 to 2015 decline in their participation to the growth in opioid prescribing.
For prime-age women, who participate at 77.8 percent, the dominant reason is caregiving: 13 percent of all women 25 to 54 were out of the labor force in 2022 to care for home or family, a share basically unchanged in a quarter century. Across everyone outside the labor force, 28 million report a disability, four times the number actually drawing federal disability insurance. And the exit is heavily sorted by schooling: among adults 25 and over, 70.7 percent of college graduates are in the labor force against 56.6 percent of people with a high school diploma and no college.
It is sorted by geography too. West Virginia participates at 53.8 percent and Mississippi at 55.0, far under the national 61.4. The Delta towns in the first piece in this series sit inside that second number: a place where nearly half the adults are outside the labor force is what these national percentages look like from the ground.
Why "just get a job" stopped being an answer
The unemployment rate says the job market is fine. The hiring data says something stranger: the market did not collapse, it seized. Employers hired at a rate of 3.4 percent of employment in June. In February the rate touched 3.1 percent, which outside the worst month of the pandemic was the weakest hiring since January 2011, when unemployment was above 9 percent. There are 7.4 million job openings, down about 40 percent from the 12.3 million peak of March 2022; there is now one opening per unemployed person where there were two. Workers can see it: the share quitting has fallen from a record 3.0 percent in late 2021 to 2.0 percent. Layoffs are low as well. Nobody is firing, nobody is hiring, nobody is moving.
A frozen market punishes anyone who has to enter it. Payrolls actually fell by 23,000 in July, in a year when monthly gains have averaged about 28,000 on the current data. A quarter of the unemployed, 25.5 percent, have now been looking for more than six months. Recent college graduates are unemployed at 5.6 percent against 4.2 percent for workers overall, and about 42 percent of the employed ones are in jobs that do not use the degree. Stanford researchers tracking millions of payroll records found employment of 22 to 25 year olds in the occupations most exposed to AI running 13 percent below their peers by mid-2025; by June 2026 the gap had widened to about 19 percent, while older workers in the same occupations show no comparable gap. The authors call the pattern descriptive rather than proof. It lands, either way, on exactly the rung people enter on.
People feel the freeze before economists name it. Since 2013 the New York Fed has asked Americans their odds of finding a new job within three months if they lost theirs. In December 2025 the average answer hit 43.1 percent, the lowest ever recorded in the survey. By July it had recovered to 46.2. In the years before the freeze it sat between 50 and 60.
What they live on
The survey asks whether you looked for work in the last four weeks. It does not ask what you sold on Saturday, and that turns out to be the more interesting question. When the Federal Reserve last measured it, 20 percent of all American adults had done gig activity for money in the previous month, and the single most common kind was not driving anyone anywhere. It was selling things: 13 percent of adults sold something for money that month, including 3 percent selling things they had made. Roughly one gig earner in four had no job at all, which works out to about 6 percent of American adults earning money while counting as not working. For 31 percent of the people doing this, the survey's phrasing is blunt: without it they would have trouble making ends meet.
The formal statistics catch pieces of the same iceberg of informal income. A record 11.9 million people told BLS their sole or main job is independent contracting. An older Fed survey found 36 percent of adults doing informal paid work across six months. Even the tax collector can see it: the IRS estimates that 55 cents of every dollar of income with no paperwork behind it goes unreported, and puts unreported sole-proprietor income at $117 billion for 2022 alone. The informal economy is not a rounding error. It is large enough to have its own line in the tax gap.
And an increasing share of it files paperwork anyway. America now has 30.4 million businesses with no employees, what the Census calls nonemployer businesses: four out of five of all businesses in the country, taking in $1.75 trillion a year. The typical one is small: three in five gross under $25,000 a year. Women own 42.3 percent of them, a far higher share than among businesses with payrolls. Americans filed a record 5.67 million new business applications in 2025, against 3.5 million in 2019; 31.2 million were filed across 2020 to 2025, the first half of 2026 was the largest on record, and about 70 percent of applications lack every trait the Census associates with ever hiring an employee. They are businesses of one, on purpose.
You can see their faces in the disclosures. Etsy told the SEC it ended 2025 with 5.6 million active sellers, of whom 89 percent are businesses of one, 97 percent work from home, 80 percent are women and 27 percent live in rural areas. The USDA's last national survey counted 8,140 farmers markets, and American farms sold $17.5 billion of food directly to the people eating it in 2022. The only census anyone has made of home bakers found 25,418 registered cottage food producers across just the 22 states that kept registries, a decade ago, before most states loosened their laws. The last time anyone measured every business in the country, 2007, more than half ran from the owner's home.
What the support pays
What does the system actually pay the people in the third box? For the retired half, it works roughly as designed. For the working-age rest, mostly it does not, and the gap between the programs people argue about and the checks people receive is wide enough to print.
| Program | Reaches | Pays | As of |
|---|---|---|---|
| Social Security, retired workers | 54.8 million people | $2,086 a month, average | July 2026 |
| Social Security disability (SSDI) | 7.0 million | $1,635 a month | July 2026 |
| Supplemental Security Income (SSI) | 7.3 million | $737 a month | July 2026 |
| SNAP (food stamps) | 36.6 million | $187 a person a month | May 2026, preliminary |
| TANF (cash welfare) | 2.0 million people, 808,000 families | varies by state | December 2025 |
| Unemployment insurance | 28 of every 100 unemployed | varies by state | 2025 |
The floor under working-age people has been dropping for decades. Unemployment insurance, the program built for exactly the moment of job loss, reached 28 percent of unemployed Americans in 2025; the rate runs from 8 percent in Florida to 52 percent in Minnesota, because states write their own rules. Cash welfare has effectively ended: AFDC reached 14.4 million people at its 1994 peak, TANF reaches 2 million now. The disability rolls have shrunk 22 percent since 2014. SNAP, the broadest program left, pays about $6.20 a person a day, reached less than half of poor households even before the current decline, and its count fell by 5.7 million people in the year to May 2026 on the preliminary data. A person under retirement age with no children and no disability finding is, in most of the country, owed nothing at all.
One quirk of the system points the other way, and it is worth knowing. The largest cash support left for working-age people, the Earned Income Tax Credit, pays nothing to somebody with no earnings, but income from self-employment counts as earnings. For a family with three children it ranged from zero to $8,046 for tax year 2025. The difference between those two numbers can literally be whether the weekend selling goes on the books. That is the IRS's rule, not our advice; the sources below link their own table.
The name on the door
In the survey's codebook, the variable that files you out of the labor force is called PREMPNOT, and its categories begin with the words NOT IN LABOR FORCE, shortened in the government's own capitals to NILF. We read that spreadsheet and named the company after the people in it. Nilfpay.
Where we come in, honestly sized
Most of the 106 million need nothing from us: they are retired, or in class, or done. We build for the slice the Fed found earning without being counted, the people already selling what they make, fix or find. That slice has faces, and our guides are full of them: the home bakers of Austin and the home cooks and bakers of the Twin Cities, selling cakes, sourdough, Sunday plates and hot sauce out of their own kitchens. What we make for them is the boring part: a shop that is one link, card payments that work the day you sign up, and no fee taken from the seller, ever. If that is you, here is how it works, and here is the door.
Sources
Every figure above, in order of first appearance. BLS series were pulled from the bureau's public API on 23 August 2026; computed figures (the 38.6 percent share, the payroll average, the business application sums) are arithmetic on the published series and can be recomputed from them.
- BLS, Current Population Survey: persons not in the labor force (LNS15000000), participation rate (LNS11300000), employment level and ratio, unemployment measures. All series pulled from the BLS public data API, 23 August 2026; latest month July 2026. data.bls.gov/timeseries/LNS15000000
- BLS, CPS public-use record layout (the codebook; variable PREMPNOT carries the NILF labels). www2.census.gov/programs-surveys/cps/datasets/2025/basic/2025_Basic_CPS_Public_Use_Record_Layout_plus_IO_Code_list.txt
- BLS, CPS concepts and definitions: who counts as not in the labor force. www.bls.gov/cps/definitions.htm
- Steven F. Hipple, "Why did labor force nonparticipation increase from 1999 to 2022?", BLS Monthly Labor Review, September 2024. The reasons breakdown and the retirement share of the rise. www.bls.gov/opub/mlr/2024/article/why-did-labor-force-nonparticipation-increase-from-1999-to-2022.htm
- BLS, Job Openings and Labor Turnover Survey, June 2026 release: hires, openings, quits, layoffs. www.bls.gov/news.release/archives/jolts_08042026.htm
- BLS, The Economics Daily: 1.0 unemployed person per job opening in June 2026. www.bls.gov/opub/ted/2026/1-0-unemployed-person-per-job-opening-in-june-2026.htm
- BLS, Employment Situation, July 2026: payrolls, unemployment, long-term share. The 28,000-a-month average is computed from the current revised payroll series (FRED, PAYEMS), which is below the 34,000 first reported. www.bls.gov/news.release/empsit.nr0.htm
- Federal Reserve Bank of New York, The Labor Market for Recent College Graduates, data through Q2 2026. www.newyorkfed.org/research/college-labor-market
- Brynjolfsson, Chandar and Chen, "Canaries in the Coal Mine?", Stanford Digital Economy Lab, 2025, and the lab's August 2026 update. ADP payroll records; the authors call the patterns descriptive, not causal. digitaleconomy.stanford.edu/news/canariesaug26/
- Federal Reserve Bank of New York, Survey of Consumer Expectations: perceived job-finding probability, December 2025 and July 2026 releases. www.newyorkfed.org/newsevents/news/research/2026/20260807
- Federal Reserve Board, Survey of Household Economics and Decisionmaking, 2024 report (published May 2025): gig activity, selling, and who does it. The 2025 report dropped the gig section, so this is the latest measure. www.federalreserve.gov/publications/2025-economic-well-being-of-us-households-in-2024-employment-and-gig-work.htm
- BLS, Contingent and Alternative Employment Arrangements, July 2023 supplement (released November 2024): 11.9 million independent contractors. www.bls.gov/news.release/conemp.nr0.htm
- Robles and McGee, "Exploring Online and Offline Informal Work", Federal Reserve Board, 2016: 36 percent of adults did informal paid work. www.federalreserve.gov/econres/feds/exploring-online-and-offline-informal-work-findings-from-the-enterprising-and-informal-work-activities-eiwa-survey.htm
- IRS, Publication 5869, Tax Gap Projections for Tax Year 2022: the 55 percent misreporting rate on low-visibility income and the $117 billion of unreported proprietor income. www.irs.gov/pub/irs-pdf/p5869.pdf
- Census Bureau, Nonemployer Statistics 2023 (released May 2025): 30.4 million businesses without employees; receipts distribution computed from the published dataset. www.census.gov/library/stories/2025/07/nonemployer-business-growth.html
- Census Bureau, Nonemployer Statistics by Demographics 2023: ownership by women, Black and Hispanic owners. www.census.gov/newsroom/press-releases/2025/business-owner-characteristics.html
- Census Bureau, Business Formation Statistics, July 2026 release and monthly series. Annual totals summed from the bureau's published CSV, August 2026 vintage. www.census.gov/econ/bfs/csv/bfs_monthly.csv
- Etsy, Inc., Form 10-K for 2025, filed with the SEC February 2026: seller counts and the seller census. www.sec.gov/Archives/edgar/data/1370637/000137063726000019/etsy-20251231.htm
- USDA NASS and AMS, National Farmers Market Managers survey, 2019; USDA ERS on 2022 direct food sales. www.nass.usda.gov/Publications/Todays_Reports/reports/nfar0820.pdf
- Institute for Justice, "Flour Power", 2017, with the peer-reviewed companion in Food Policy, 2018: the only census of registered cottage food producers. ij.org/report/cottage-foods-survey/
- Census Bureau, 2007 Survey of Business Owners: 51.6 percent of businesses home-based, the last economy-wide measure. www.census.gov/newsroom/blogs/random-samplings/2011/06/half-of-us-businesses-operated-from-the-home.html
- Social Security Administration, Monthly Statistical Snapshot, July 2026 (and December 2014 for the SSDI comparison). www.ssa.gov/policy/docs/quickfacts/stat_snapshot/
- USDA Food and Nutrition Administration, SNAP national level monthly data, as of August 2026. May 2026 is preliminary. www.fna.usda.gov/pd/supplemental-nutrition-assistance-program-snap
- CMS Medicaid and CHIP enrollment reports, April 2026 preliminary, as compiled in KFF's enrollment tracker. www.kff.org/medicaid/medicaid-enrollment-tracker/
- Federal Reserve community development research on Department of Labor data: the unemployment insurance recipiency rate, 2025. fedcommunities.org/why-dont-more-out-work-people-receive-unemployment-insurance/
- HHS Administration for Children and Families, TANF caseload data FY2025; HHS ASPE for the 1994 AFDC peak. acf.gov/ofa/data/tanf-caseload-data-2025
- IRS, Earned Income Tax Credit tables, tax year 2025: earned income required, self-employment income counts. www.irs.gov/credits-deductions/individuals/earned-income-tax-credit/earned-income-and-earned-income-tax-credit-eitc-tables
- Alan B. Krueger, "Where Have All the Workers Gone?", Brookings Papers on Economic Activity, 2017, corrected January 2019: pain medication and prime-age men. We print the corrected 43 percent, not the original 20. www.brookings.edu/articles/where-have-all-the-workers-gone-an-inquiry-into-the-decline-of-the-u-s-labor-force-participation-rate/